Billboard Ad Pricing and ROI: A Practical Guide for 2026
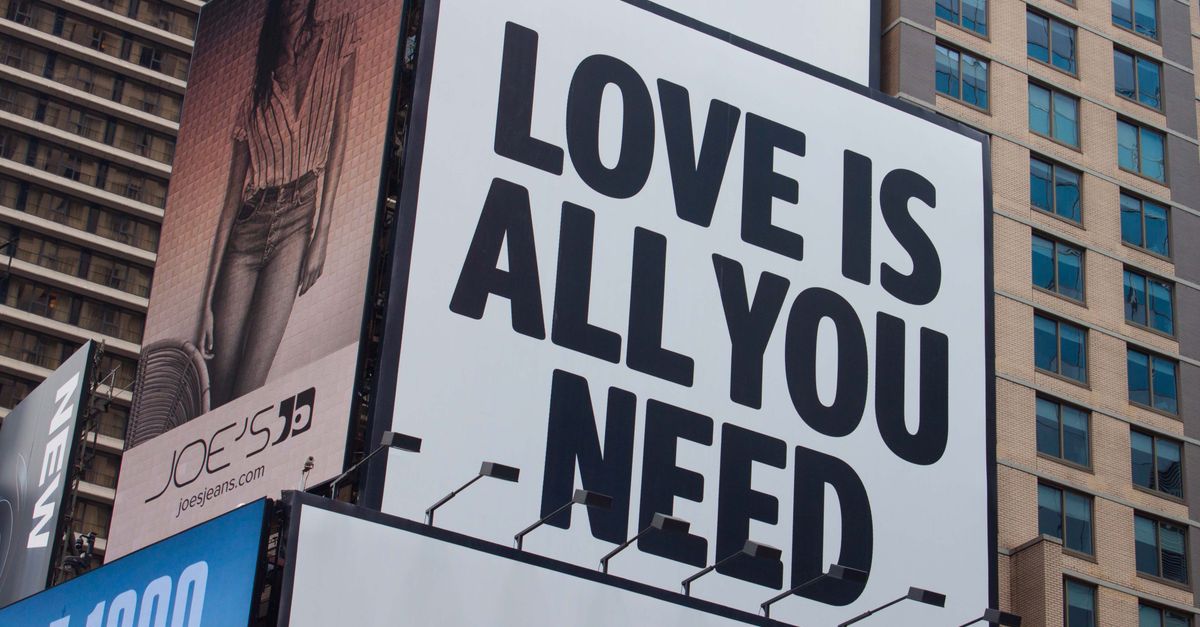
When a brand asks me how much it should spend on billboard advertising, I don’t start with a sales pitch. I ask three hard questions: Where does the audience live? What traffic volume supports my message? And what return can I realistically expect? In this guide I lay out the pricing models, cost drivers, ROI calculation steps, and creative tactics that turn static billboards into measurable assets.
1. Understanding Billboard Types and Pricing Models
Billboard inventory today comes in two main flavors: static (traditional) and transit (bus, train, van). Each has its own pricing structure that reflects placement value, audience reach, and creative flexibility.
Categories of Static Billboards
- Standard: The most common format, typically 14’ x 48’, placed at high‑traffic intersections or along major highways.
- Premium: Located in dense urban cores or near landmark attractions; often command higher CPM due to concentrated footfall.
- Digital: LED panels that can display multiple creatives and update content remotely; pricing includes both placement and data‑streaming fees.
Transit Advertising Specifics
- Bus & Van: Full wrap or half‑wrap designs covering the vehicle’s exterior, offering 24/7 exposure to commuters across neighborhoods.
- Train Car: Interior panels and external wraps that reach both local and regional audiences during daily commutes.
Common Pricing Models
- Cost Per Placement (CPP): Fixed fee for a specific billboard or transit unit regardless of exposure.
- Cost Per Thousand Impressions (CPM): Calculated using projected footfall or vehicle pass‑through numbers. For example, a 14’ x 48’ billboard in downtown Seattle might have an estimated 500,000 daily impressions; at $200 CPM this translates to $100,000 per month.
- Dynamic Pricing: Prices fluctuate with demand—peak hours, holidays, and high‑traffic seasons command premium rates.
- Package Deals: Bundled campaigns that include multiple billboards across regions at a discounted rate; often include cross‑channel digital support to reinforce the message.
The choice depends on your campaign goals. For brand awareness you lean toward CPM; for local market penetration CPP often delivers better control over spend.
2. Static Billboards vs Transit Ads: Key Cost Drivers
While both media share a common objective—visibility—they differ in audience composition, creative duration, and logistical complexity. The cost drivers reflect these differences:
Five Primary Cost Factors
- Location Footfall: High‑traffic intersections or highway exits carry the highest premiums.
- Audience Demographics: Targeting affluent neighborhoods or niche commuter routes can increase unit rates.
- Creative Size & Complexity: Larger, high‑resolution images or video-ready transit ads demand more production expense.
- Duration of Display: Longer campaigns lock in higher costs but often secure better rates per day.
- Seasonality & Event Timing: Holiday periods and local events push prices upward due to heightened visibility.
Transit ads add an extra layer: vehicle maintenance, route agreements, and branding consistency across fleets. These factors can inflate costs by 10–30% compared to static billboards in similar traffic zones.
Audience Segmentation Differences
- Static: Primarily reaches drivers and pedestrians within a fixed radius; ideal for local brand statements or event announcements.
- Transit: Captures a mobile audience that travels across multiple neighborhoods, making it effective for regional roll‑outs or point‑of‑sale promotions.
Example Cost Comparison
Assume a 30‑day campaign in two cities: one static billboard in New York City’s Times Square and a bus wrap on a city shuttle. The Times Square spot might cost $150,000 (CPP) while the shuttle wrap could run for $90,000, including production and route fees. Despite the lower total, the shuttle delivers exposure to 1.2 million commuters per month versus 800,000 impressions for the billboard—illustrating how context shapes value.
3. Calculating ROI for Billboard Campaigns
ROI is not a magic number; it’s derived from aligning spend with measurable outcomes—leads, sales, or brand lift. Follow these six steps:
Step‑by‑Step ROI Calculation
- Define Objectives: e.g., 10% increase in local store traffic or $5k additional revenue.
- Estimate Reach: Use traffic data (vehicles per day) and average dwell time to compute impressions.
- Assign Value Per Impression: Convert impressions into expected conversion rate using historical data.
- Calculate Gross Revenue: Multiply conversions by average order value.
- Add Incremental Costs: Include creative production, placement fees, and monitoring tools.
- Compute ROI: (Gross Revenue – Total Cost) ÷ Total Cost × 100%.
Example: A $12k transit campaign generates 1.2 million impressions. With a conversion rate of 0.5% and an average sale of $120, the gross revenue equals $720k. After accounting for $30k in production and monitoring costs, ROI is (720-42)/42 × 100 ≈ 1657%. This simplified model shows that billboard spend can be highly lucrative when paired with a strong conversion funnel.
Real‑World Attribution Techniques
- QR Codes: Scanned within minutes of seeing the ad, linking to a unique landing page that logs visitor data.
- SMS Shortcodes: Texting a keyword triggers a discount code; each redemption is traceable back to the billboard.
- Phone Numbers with Call Tracking: Unique numbers embedded in the creative allow you to attribute inbound calls directly to the campaign.
Integrating these touchpoints into your sales funnel ensures that every dollar spent translates into a verifiable metric. Combine the data with post‑campaign surveys or mobile app analytics for deeper insight.
4. Creative Strategies to Maximize Impact
A static image on a billboard is only as good as its ability to capture attention and communicate intent in seconds. Below are tactics that have proven effective across campaigns I've managed.
Five Creative Tactics
- Simplicity: Use bold colors, minimal text, and clear calls‑to‑action.
- Storytelling Elements: Incorporate narrative cues—before/after shots or a short tagline that invites curiosity.
- Local Relevance: Embed community symbols or local slang to create instant resonance.
- Interactive QR Codes: Drive mobile engagement and track responses in real time.
- Dynamic Content: For transit ads, use rotating messages that change per route segment, keeping commuters engaged.
Case Study: Seasonal Campaign for a Boutique Retailer
The retailer wanted to promote its winter collection on a 30‑day billboard in a high‑traffic mall. By pairing a striking seasonal image with a QR code that offered a 15% instant discount, the campaign drove a 20% increase in in‑store foot traffic and $8k additional revenue—well above the projected $5k goal.
Additional Creative Tips
- Color Psychology: Warm hues like red or orange can stimulate urgency; cool tones like blue convey trust.
- Text Hierarchy: Place headline at eye level, sub‑headline lower, and CTA in the bottom corner to guide the viewer’s gaze.
- Brand Consistency: Use the same visual language across digital and offline assets so audiences recognize the brand instantly.
Testing different creative variants on a small scale before full rollout can reduce wasted spend by 20–30%.
5. Common Pitfalls and How to Avoid Them
A lot of brands overpay for billboard inventory because they ignore data or fail to integrate the ad into their broader strategy.
- Ignoring Traffic Data: Placing a billboard in a low‑traffic area dilutes impact.
- Lack of Call‑to‑Action: A great image without a clear next step is just eye candy.
- Short Campaign Duration: One day isn’t enough for most audiences to absorb the message.
- Inconsistent Brand Voice: Mixing billboard messaging with digital ads that feel disjointed can confuse consumers.
To stay on track, always benchmark your billboard spend against digital channels and adjust based on performance metrics.
Best Practices for Budget Discipline
- Use Programmatic Buying: For transit fleets, programmatic platforms can secure competitive rates by comparing real‑time inventory across carriers.
- Negotiate Bundle Discounts: Request multi‑city packages or seasonally aligned deals; many owners offer 10–15% off for longer commitments.
- Regular Audits: Conduct quarterly reviews of impressions, conversions, and spend to identify underperforming units early.
Billboard advertising remains one of the most reliable ways to build brand awareness when executed with data‑driven precision and creative clarity.
What metrics do you track to evaluate the success of your billboard or transit campaigns?