Comparing DOOH Advertising Options in 2026: Static, Transit, and Interactive Billboards
Outdoor advertising is no longer a one‑size‑fits‑all solution. In 2026, brands can choose from traditional static billboards, transit‑mounted displays, or fully interactive digital out‑of‑home (DOOH) installations. Each format offers distinct reach, engagement potential, and pricing structures. This guide breaks down the key differences, helps you evaluate costs, and shows how to pick the right platform for your campaign objectives.
Outdoor Billboards Overview
Static billboards remain the backbone of outdoor advertising on highways and in city centers, while transit billboards add a mobile dimension that targets commuters. Both formats share considerations such as size, location, audience demographics, and duration; the main distinction is mobility versus permanence.
Key Elements of Traditional and Transit Billboards
- Size & Visibility: 30 × 60 to 40 × 80 feet. Larger displays command higher rates but capture more eyeballs.
- Location Type: Highway exits, urban intersections, or transit hubs affect impressions—interstate exit billboards can reach ~40,000 vehicles/day versus ~5,000 pedestrian counts for curbside spots.
- Audience Profile: Demographics vary by route; downtown loops skew young professionals, suburban lines target families and middle‑income drivers.
- Duration & Frequency: Longer runs boost exposure but increase cost; many agencies lock in seasonal peaks with 12‑week contracts.
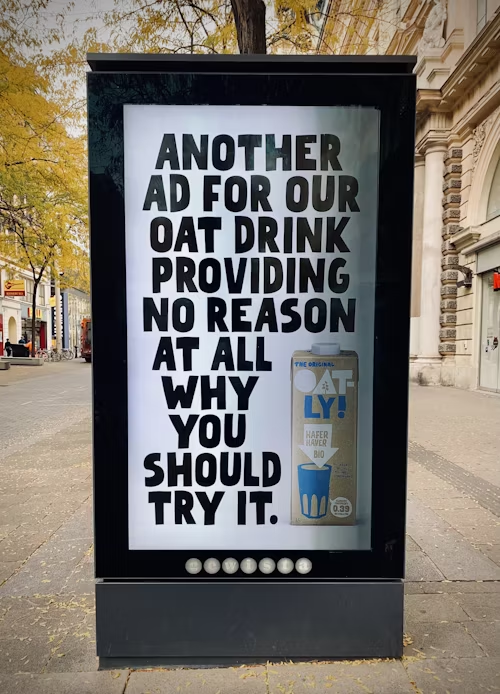
- Creative Flexibility: Static ads rely on strong imagery and concise copy, while transit displays can incorporate brief video loops during stop‑and‑go cycles.
- Regulatory Constraints: Local ordinances limit size, lighting, or placement; residential zones may prohibit illuminated signs.
Interactive Billboard Ads: Features, Benefits, and Use Cases
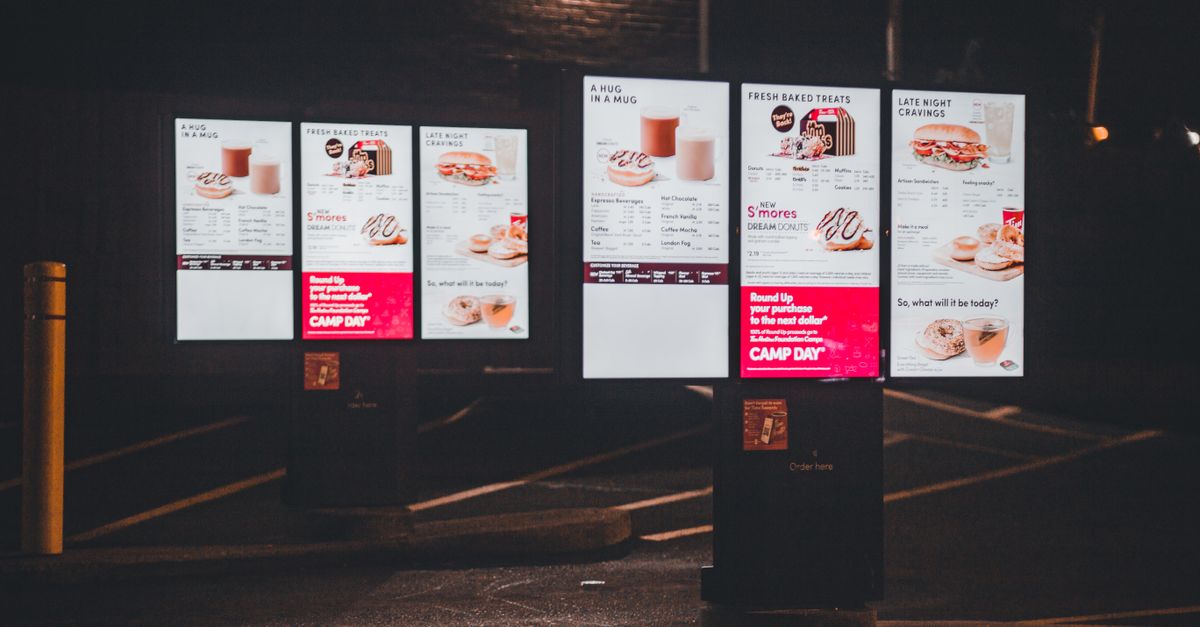
Interactive billboards use high‑resolution screens with touch, motion sensors, or AR to turn passive viewers into active participants, increasing dwell time and data capture.
What Makes an Interactive Billboard Different?
- Touch & Gesture Controls: Tap, swipe, or wave to trigger content variations, creating a game‑like experience.
- Real‑Time Data Integration: Dynamic messaging that responds to live feeds—e.g., weather alerts for coffee ads.
- AR Overlays: Project 3D objects onto the environment via smartphones, encouraging shareable moments.
- Multi‑Channel Syncing: Coordinate with mobile apps or social media for cross‑device engagement.
- Analytics Dashboards & CMS: Capture interaction counts, dwell time, and demographic proxies; update campaigns remotely across networks.
- Higher Production Costs: Specialized hardware, software licenses, and maintenance offset by higher engagement rates.
Designing an Interactive Campaign
Start with a clear user journey—quiz, QR scan, or virtual product exploration. Prototype on smaller screens to test usability before scaling to 60‑foot panels. Keep the visual hierarchy simple: bold headlines, minimal text, and high‑contrast colors for readability from distance while inviting closer inspection.
Billboard Ad Pricing Models in 2026
Pricing varies by format, location, and interactivity level. Static displays charge per foot or placement; transit billboards often use a cost‑per‑impression (CPI) model tied to ridership data. Interactive platforms add licensing fees for software and sensor hardware plus ongoing support.
Factors Influencing Cost Across All Formats
- Geographic Premium: Urban spots demand higher rates; Times Square can be 5× more expensive than a mid‑size city.
- Display Size & Resolution: Larger, high‑definition screens cost more to produce and power—e.g., $8–$10 per foot per week for a 60‑foot LED panel.
- Placement Duration: Longer contracts unlock discounts; short bursts command premium rates during holidays or events.
- Audience Reach Metrics: CPM drives transit pricing; a 1 CPM on a bus route equals roughly $0.10 per 1,000 passengers.
- Creative Production: Animated or interactive content adds 25–35% to the spend.
- Technology Licensing & Maintenance: Software subscriptions and remote monitoring add recurring costs—typically 10–15% of hardware expenses annually.
Choosing the Right Outdoor Advertising Platform for Your Campaign
Selecting between static, transit, or interactive billboards depends on campaign goals, target audience, budget, and desired engagement level. Consider these criteria when mapping out your media mix.
Decision Criteria to Match Goals and Budget
- Objective: Brand awareness favors high‑visibility static displays; lead generation benefits from interactive capture forms funneling data into CRM systems.
- Audience Mobility: Transit routes suit commuters; pedestrians near city centers favor static spots.
- Budget Flexibility: Interactive solutions require higher upfront and ongoing costs but offer richer data; static placements deliver cost‑effective reach for limited budgets.
- Creative Complexity: Motion or real‑time updates lean toward interactive platforms.
- Measurement Needs: Built‑in analytics dashboards provide precise attribution; otherwise, rely on third‑party traffic estimates.
- Regulatory Landscape & Campaign Duration: Some cities restrict signage size or lighting; short campaigns can use pop‑up kiosks, while long runs lean toward static billboards for cost efficiency.
Scenario Example: Luxury Car vs. Discount Grocery
A luxury car manufacturer targeting affluent 30–45 year olds might opt for high‑impact highway billboards in upscale suburbs, paired with transit ads on premium commuter buses near corporate parks. In contrast, a discount grocery chain aiming for impulse shoppers could deploy interactive kiosks at subway stations where commuters scan coupons directly from the billboard.
Common Pitfalls in Outdoor Billboard Campaigns
Outdoor advertising offers high exposure, but missteps can erode ROI. Below are frequent mistakes and how to avoid them.
Avoid These Errors to Protect ROI
- Overlooking Audience Context: Match the message to local demographics; placing a luxury car ad on a low‑income route dilutes impact.
- Inadequate Creative Design: Small fonts or cluttered layouts reduce readability from distance. Use legible typefaces and keep copy under 10 words per headline.
- Ignoring Placement Timing: Weekday rush hours differ from weekend traffic; schedule creative updates to match peak viewing windows.
- Underestimating Maintenance Costs: Interactive displays can fail; plan for spare parts and quick repair services, especially in high‑traffic urban cores.
Measuring the Return on Investment of DOOH Campaigns
Quantifying outdoor campaigns blends traditional metrics with digital analytics to link impressions, engagement, and conversion data back to spend.
Metrics and Tools for Accurate Evaluation
- Impression Counts: Traffic counts or transit ridership data estimate reach; combine with geographic heat maps for finer granularity.
- Dwell Time & Engagement: Interactive billboards log how long users interact, indicating message depth.
- Conversion Tracking: QR codes, short URLs, and mobile app links funnel viewers into measurable actions; track click‑through rates and subsequent purchases.
- A/B Testing: Run parallel creatives on similar locations to isolate performance differences; use statistical significance thresholds to guide decisions.
- Attribution Modeling: Combine DOOH data with other channels for holistic ROI insights; consider multi‑touch attribution frameworks that credit each interaction appropriately.
In 2026, the most successful outdoor advertising strategies blend traditional reach with digital interactivity. By carefully assessing your objectives, audience, and budget—and by avoiding common pitfalls—you can craft campaigns that not only capture attention but also deliver measurable results.
How do you balance the higher upfront cost of interactive billboards against their potential for deeper consumer engagement in your next campaign?